Contents
Updated on 2021-03-21
Monitoring
I had k8s running for a while and when a had issues with something It was not easy to troubleshoot. So I started looking into adding logging and monitoring to the cluster.
It happens that prometheus + grafana + fluentd was way too heavy for 2 raspberry with my application running in it. I mean, just my application was using like 60-70% of the RAM resources… No way I could add prometheus to it…
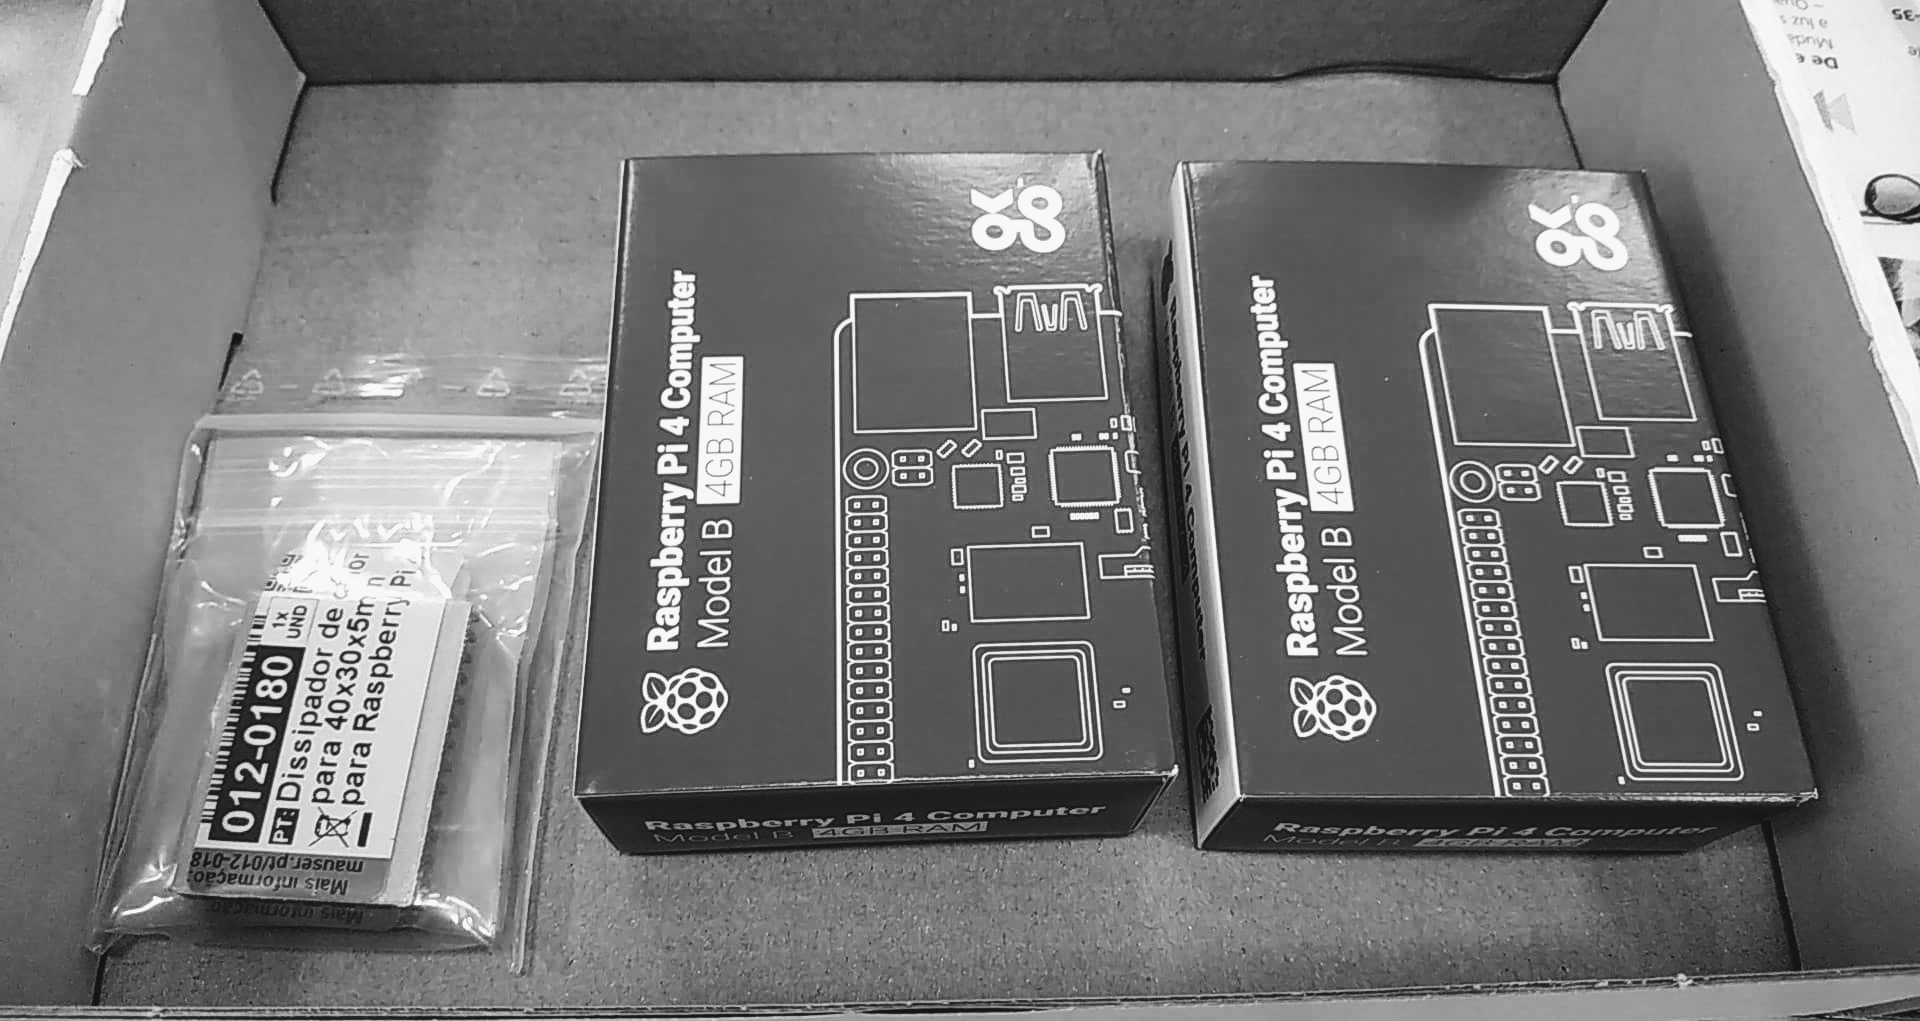
So yeah… I added 2 more PIs to the cluster 😄 …

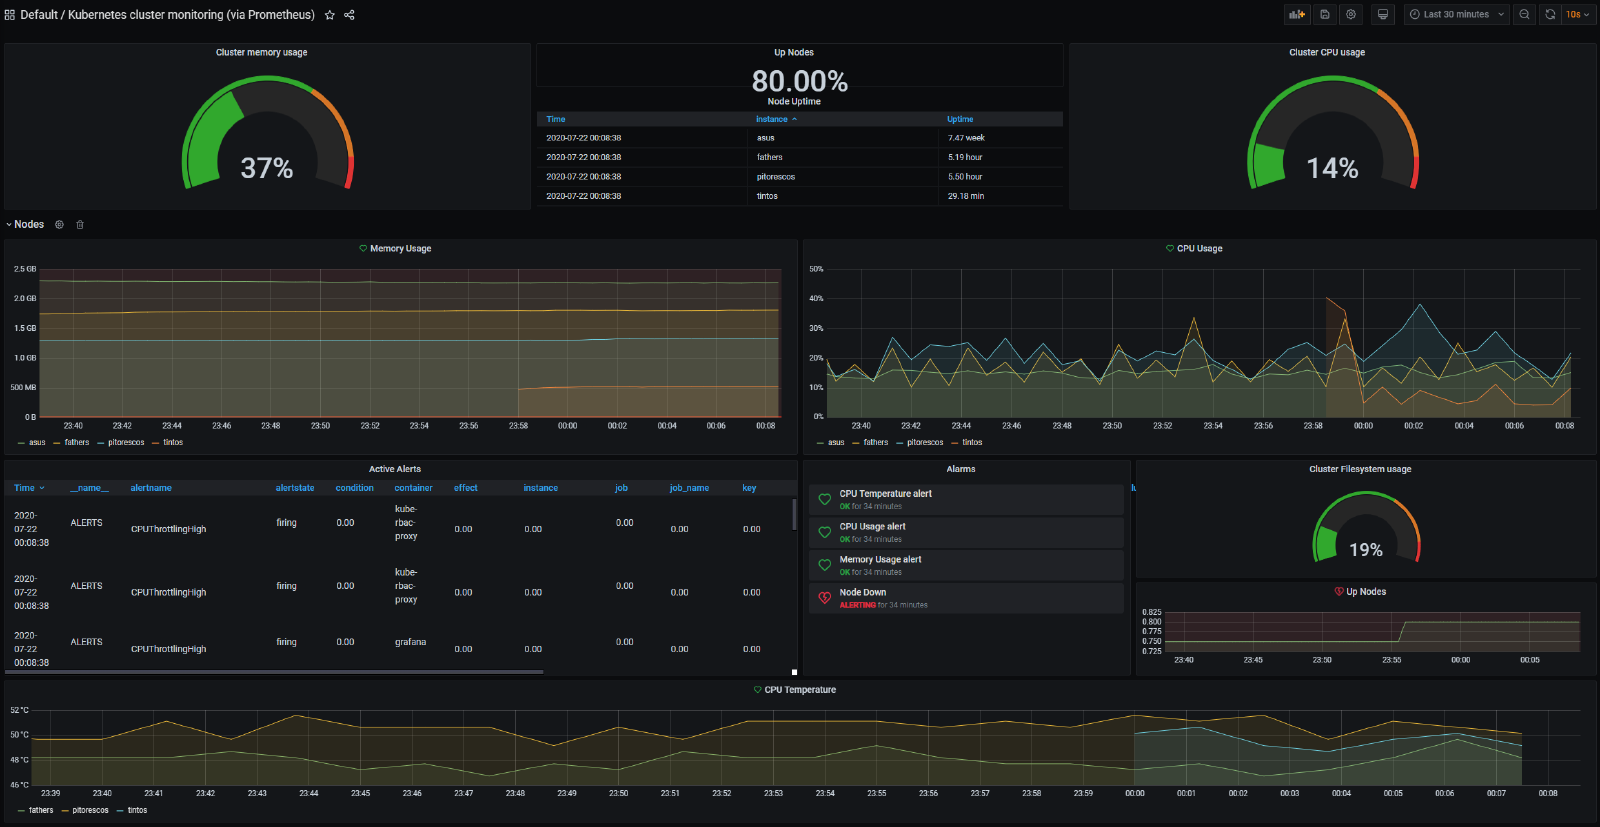
Ok, I immediately started working on having the monitoring ready. I found this https://github.com/carlosedp/cluster-monitoring and it was really easy to get it working.
(unfinished post…)